19+ Amazon Logistics Statistics: A Must Know in 2025
Amazon Logistics is a key component in how the company ensures timely delivery of packages to customers around the globe. But just how extensive is this massive operation?
With that in mind, I’ll cover Amazon logistics statistics that provide insights into the scale and efficiency of Amazon’s logistics network.
Amazon Logistics Statistics: The Key Data
- There are over 275,000 Amazon delivery drivers.
- Amazon delivers more than 10 million customer packages every day.
- Amazon has more than 3,000 DSPs all around the world.
- Amazon Logistics had a 22% share of the parcel delivery market (by volume) last year, while UPS had a 24% share.
- About 4.75 billion packages were delivered in the United States by Amazon Logistics in 2021.
- Amazon’s logistics business generated more than $80 billion in revenue worldwide in 2020.
- DSPs deliver about 45% to 50% of Amazon’s total 8.17 billion packages.
- Approximately 1 in 5 Amazon delivery drivers are injured on the job annually.
- Injury rates for DSP drivers increased by 38% between 2020 and 2021.
- Amazon drivers are expected to deliver approximately 250-300 packages per day, with approximately 200 stops spread out.
- Avergae DSPs employ up to 100 people and have 20-40 Amazon vans.
- On average, 90% of Amazon delivery drivers complete their routes within the allotted time.
- Amazon has 40,000 semi-trucks in its expanding fleet.
- Amazon’s Logistics division is currently worth $310 billion and has the potential to be worth more than $1 trillion by 2031.
- Amazon currently operates 110 fulfillment centers in the United States and 185 globally.
Source: (Statista, CivicScience, University of Washington, S&P Global, Global Marketing Professor, Amazon, GeekWire, The Seattle Times, CNB, CNN, Bloomberg L.P.)
To learn more about Amazon statistics and data in detail on this resource page.
Amazon Logistics U.S Market Share
These percentages represent the market share by parcel volume in the U.S. for 2023.
- Amazon Logistics: 27%
- USPS: 31%
- UPS: 21%
- FedEx: 18%
- Others: 3%
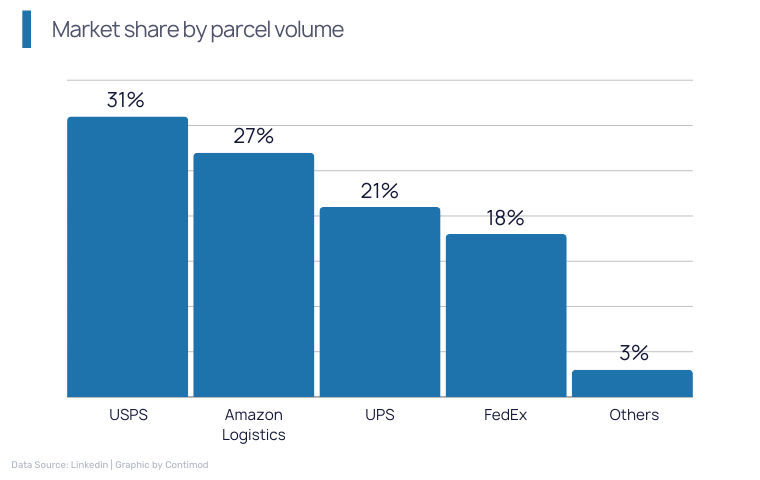
Source: Linkedin
Amazon Logistics Revenue
Amazon Logistics revenue has shown consistent growth over the past years. Below is a detailed look at the annual revenue statistics:
| Year | Revenue (in billions) | Revenue Growth Rate (%) |
|---|---|---|
| 2017 | 31.88 | N/A |
| 2018 | 42.75 | 34.1% |
| 2019 | 53.76 | 25.7% |
| 2020 | 80.44 | 49.6% |
Source: Statista
Amazon Logistics Volume
Based on the Pitney Bowes Parcel Shipping Index, Amazon Logistics sent 5.9 billion packages in 2023, which is 15.7% more than in 2022. Let us take a look at the last five years of Amazon parcel volume.
| Year | Packages Delivered (billion) | Growth Rate (%) |
|---|---|---|
| 2018 | 0.8 | N/A |
| 2019 | 2.0 | 150.0% |
| 2020 | 4.26 | 112.9% |
| 2021 | 4.77 | 11.9% |
| 2022 | 4.79 | 0.4% |
| 2023 | 5.9 | 15.7% |
Source: Statista, Pitney Bowes Parcel Shipping Index
Amazon DSPs Statistics
Amazon DSPs form a vast network that delivers packages to customers worldwide. Here are key insights into the operations of DSPs:
- Amazon has more than 3,000 DSPs all around the world.
- Amazon has more than 275,000 drivers who deliver more than 10 million packages every day.
- Amazon DSPs deliver more than 10 million packages for customers every day.
- DSPs deliver about 45% to 50% of Amazon’s total 8.17 billion packages.
- Approximately 1 in 5 Amazon delivery drivers are injured on the job annually.
- Injury rates for DSP drivers increased by 38% between 2020 and 2021.
- Amazon drivers are expected to deliver approximately 250-300 packages per day, with approximately 200 stops spread out.
- Avergae DSPs employ up to 100 people and have 20-40 Amazon vans.
- On average, 90% of Amazon delivery drivers complete their routes within the allotted time.
- DSPs have generated $26 billion in revenue over the last four years.
Sources: (Amazon, GeekWire, The Seattle Times, CNBC, Amazon, CNN, Bloomberg L.P.)