9+ Shipping Damage Statistics Must Know in 2024
Shipping damage presents a major challenge in commerce as it leads to financial losses and customer dissatisfaction for both businesses and consumers. But just how prevalent is this problem?
With that in mind, I’ll cover shipping damage statistics that reveal the extent and consequences of shipping damage.
Shipping Damage Statistics: Key Numbers
- 0.5% of gross sales are lost due to shipping damage.
- 85 million damaged packages arrived on doorsteps in the last 12 months.
- 10% of eCommerce packages arrive damaged.
- The total cost of damaged deliveries amounted to approximately $2.92 billion in the past year.
- 57% of consumers would be hesitant to shop with a retailer again if they received a broken or damaged item.
- 11% of goods arrive at distribution centers damaged.
- Damaged packages are most common with UPS (11%), USPS (10%), and FedEx (7%).
- 5 billion pounds of returned eCommerce items end up in landfills every year.
- 21% of U.S. adults who have bought such a large item in the last year had it arrive damaged.
- 34% of packaging-related returns are due to product damage.
- 41% of consumers experience a negative impact on brand image when a shipment is lost, delayed, or arrives damaged.
- 20% of eCommerce returns are due to damaged products.
- 39% of online consumers will not repeat their purchase if they receive defective packaging.
Source: (Lantech, Packaging Digest, Speed Commerce, Lantech, Shipearly, Amcor. New York Post, The Sun)
Percentage of Damaged Packages by Carrier
UPS, USPS, and FedEx show different rates of damaged packages. Here’s a quick look at how each one does with handling your stuff:
- UPS: 11%
- USPS: 10%
- Fedex: 7%
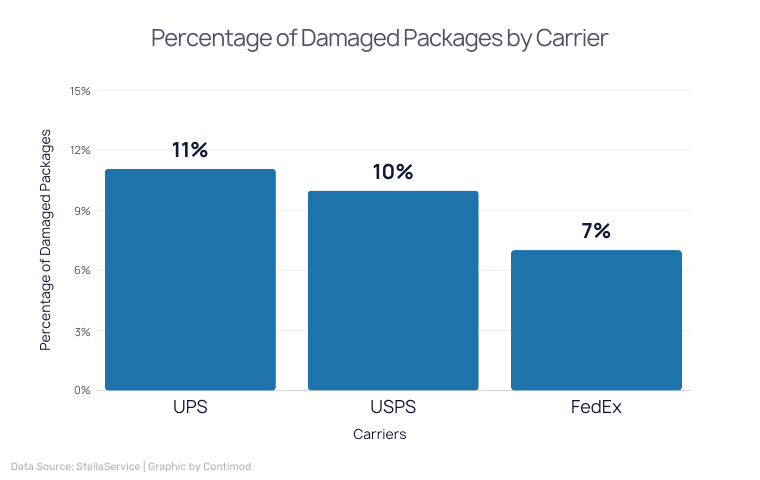
Source: StellaService
Main Causes of Online Purchase Returns
Online purchase returns usually happen because of issues like damaged goods or wrong sizes. Here’s why customers send stuff back:
- 81% of returns are because the item is damaged or defective.
- 75% of returns happen because the item doesn’t fit.
- 56% of people return items that don’t match the description.
- 33% of return items because they don’t like them.
- 14% of return items after ordering multiple items or sizes.
- 11% of returns are due to the item arriving late.

Source: Statista